Sunday, 21 May 2017

SIA (C6L) - 19 May 2017

Surprise Q4 loss sends SIA shares diving 7.25%


SIA weekly chart shows that the weekly uptrend is broken after the Q4 results.

The technical support for SIA is at $9.95 and next support is at $9.84.

The technical resistance is at $10.04 and the next resistance level is at $10.13.

Thursday, 18 May 2017

SingTel (Z74) - 18 May 2017

Singtel not immune to competition, as Indian operations hit earnings


SingTel weekly chart shows that is it trading side ways for the past 5 weeks.

The technical support level is at $3.71 and the next support is at $3.62.

The resistance is at $3.76 and $3.81.

Monday, 15 May 2017

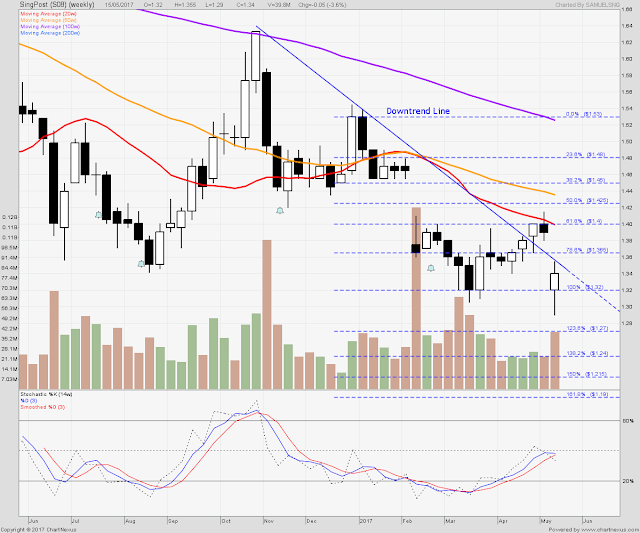
SingPost (S08) - 15 May 2017

SingPost slides 4.3% after TradeGlobal writedown


SingPost weekly chart shows a long-term downtrend since the peak in October 2016.

The current price resistance is at $1.365 and next resistance level is at $1.40.

The price support levels are at $1.320 and $1.270.

Wednesday, 10 May 2017

OCBC (O39) - 09 May 2017

OCBC Q12017 profit rises 14%, driven by wealth management business


OCBC is on a strong uptrend since my previous post.

The current support levels are $10.40 and $10.22.

The technical resistance levels are $10.51 and $10.61.

Stochastic is currently at over-bought region.

Monday, 8 May 2017

Sheng Siong (OV8) - 08 May 2017

What's in store for Sheng Siong this year?
http://sbr.com.sg/retail/news/whats-in-store-sheng-siong-year

From Sheng Siong's weekly chart, it shows a gradual uptrend.

The support levels are currently at $1.00 and $0.980,

The resistance levels are at $1.02 and $1.05.

Stochastic levels indicates it is currently near the over-bought region. 

Wednesday, 3 May 2017

Sembcorp Ind (U96) - 03 May 2017

Sembcorp Industries' new CEO announces strategic review; Q1 profit up 11.3%


The weekly chart shows Sembcorp Industry is on a downtrend. However the Q1 result may break this downtrend. 

The current price support is at $2.98 and $2.90

The technical prices resistance levels are at $3.08 and $3.19

Tuesday, 2 May 2017

DBS (D05) - 02 May 2017

Quality earnings drive investors back to Singapore bank stocks


DBS weekly charts shows uptrend since November 2017.

The technical price support levels are at $20.08 and $19.40.

The technical resistance levels are at $20.51 and $20.85.

Monday, 1 May 2017

UOB (U11) - 28 Apr 2017


UOB’s Q1 net profit up 5.4%, asset quality stable


UOB weekly chart shows uptrend since Nov 2016.

UOB price has broke above the $21.85 resistance due to Q1 net profit results.