Storm clouds darken over M1 as takeover plans fall through
https://www.theedgesingapore.com/storm-clouds-darken-over-m1-takeover-plans-fall-through
M1 weekly downtrend resumes in June 2017.
The price gaped down today after 2Q earnings falls 21% to $32.5 mil.
The current price support is at $1.95 and next support is at $1.86.
The price resistance levels are $2.01 and $2.06
Tuesday, 18 July 2017
Monday, 17 July 2017
Keppel DC REIT (AJBU) - 17 Jul 2017
Keppel DC REIT 2Q DPU up 4.2% to 1.74 cents
https://www.theedgesingapore.com/keppel-dc-reit-2q-dpu-42-174-cents
Keppel DC REIT has been on a good uptrend since Mar 2017.
Technically upside is limited at resistance $1.325 and next resistance is at $1.335.
Price support is currently at $1.315 and $1.295.
https://www.theedgesingapore.com/keppel-dc-reit-2q-dpu-42-174-cents
Keppel DC REIT has been on a good uptrend since Mar 2017.
Technically upside is limited at resistance $1.325 and next resistance is at $1.335.
Price support is currently at $1.315 and $1.295.
Sunday, 16 July 2017
SPH (T39) - 14 Jul 2017
SPH's net profit down 45.2% to $28.9m
Singapore Press Holdings Limited (SPH) is on a long-term downtrend.
The weekly chart shows support at $3.02 and next support level is at $2.97.
The resistance levels are at $3.07 and $3.16.
Stochastic shows oversold.
If you still like to buy this stock, it will be better to wait for a firm support before buying it.
Tuesday, 20 June 2017
Noble (CGP) - 20 June 2017
Indebted Noble confirms bank loan relief, shares climb further
Noble weekly chart shows a strong price support at $0.285 and resistance is at $0.520.
Stochastic is at oversold region and turning up.
Sunday, 21 May 2017
SIA (C6L) - 19 May 2017
Surprise Q4 loss sends SIA shares diving 7.25%
SIA weekly chart shows that the weekly uptrend is broken after the Q4 results.
The technical support for SIA is at $9.95 and next support is at $9.84.
The technical resistance is at $10.04 and the next resistance level is at $10.13.
Thursday, 18 May 2017
SingTel (Z74) - 18 May 2017
Singtel not immune to competition, as Indian operations hit earnings
SingTel weekly chart shows that is it trading side ways for the past 5 weeks.
The technical support level is at $3.71 and the next support is at $3.62.
The resistance is at $3.76 and $3.81.
Monday, 15 May 2017
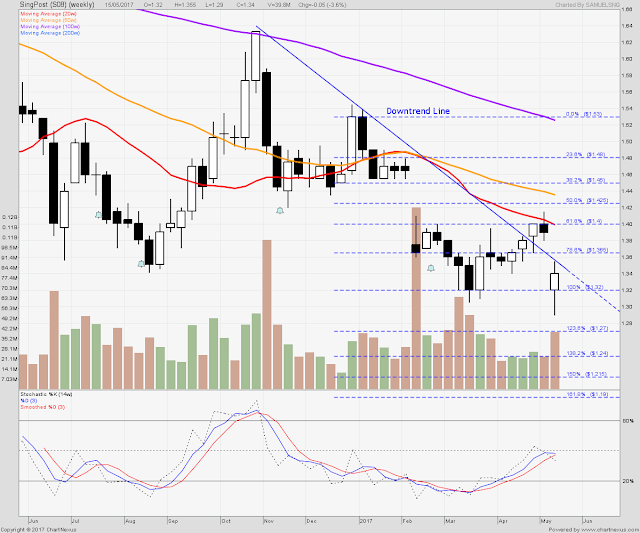
SingPost (S08) - 15 May 2017
SingPost slides 4.3% after TradeGlobal writedown
SingPost weekly chart shows a long-term downtrend since the peak in October 2016.
The current price resistance is at $1.365 and next resistance level is at $1.40.
The price support levels are at $1.320 and $1.270.
Wednesday, 10 May 2017
OCBC (O39) - 09 May 2017
OCBC Q12017 profit rises 14%, driven by wealth management business
OCBC is on a strong uptrend since my previous post.
The current support levels are $10.40 and $10.22.
The technical resistance levels are $10.51 and $10.61.
Stochastic is currently at over-bought region.
Monday, 8 May 2017
Sheng Siong (OV8) - 08 May 2017
What's in store for Sheng Siong this year?
http://sbr.com.sg/retail/news/whats-in-store-sheng-siong-year
From Sheng Siong's weekly chart, it shows a gradual uptrend.
The support levels are currently at $1.00 and $0.980,
The resistance levels are at $1.02 and $1.05.
Stochastic levels indicates it is currently near the over-bought region.
http://sbr.com.sg/retail/news/whats-in-store-sheng-siong-year
From Sheng Siong's weekly chart, it shows a gradual uptrend.
The support levels are currently at $1.00 and $0.980,
The resistance levels are at $1.02 and $1.05.
Stochastic levels indicates it is currently near the over-bought region.
Wednesday, 3 May 2017
Sembcorp Ind (U96) - 03 May 2017
Sembcorp Industries' new CEO announces strategic review; Q1 profit up 11.3%
The weekly chart shows Sembcorp Industry is on a downtrend. However the Q1 result may break this downtrend.
The current price support is at $2.98 and $2.90
The technical prices resistance levels are at $3.08 and $3.19
Tuesday, 2 May 2017
DBS (D05) - 02 May 2017
Quality earnings drive investors back to Singapore bank stocks
DBS weekly charts shows uptrend since November 2017.
The technical price support levels are at $20.08 and $19.40.
The technical resistance levels are at $20.51 and $20.85.
Monday, 1 May 2017
UOB (U11) - 28 Apr 2017
UOB’s Q1 net profit up 5.4%, asset quality stable
UOB weekly chart shows uptrend since Nov 2016.
UOB price has broke above the $21.85 resistance due to Q1 net profit results.
Monday, 17 April 2017
M1 (B2F) - 17 Apr 2017
M1 1Q net profit down 14.6% to $36.3 mil on higher expenses
The M1 weekly chart shows that it is still on a weekly uptrend.
The technical support is at $2.12 and next support level is at $2.07.
The resistance levels are at $2.17 and $2.24.
Wednesday, 12 April 2017
SPH (T39) - 12 Apr 2017
SPH Q2 net profit slips 1.2% on lower media revenue, to pay S$0.06 per share dividend
The weekly chart of SPH shows that it is on a long-term downtrend.
Technical price support is at $3.44 and next level is at $3.39.
The technical resistance levels are at $3.53 and $3.61.
Wednesday, 1 March 2017
YZJ Shipbldg SGD (BS6) - 01 Mar 2017
Yangzijiang Q4 net profit leaps to 607.8m yuan on advance payments
Yangzijiang is currently on uptrend with good daily trading volume.
The technical price support is at $0.965 and $0.945.
Resistance levels are at $0.995 and $1.025.
Thursday, 23 February 2017
Sembcorp Ind (U96) - 23 Feb 2017
Sembcorp Industries' Q4 profit more than doubles to S$147.5 million
http://www.todayonline.com/business/sembcorp-industries-q4-profit-more-doubles-s1475-million
Sembcorp Ind has been on the uptrend since 27 Oct 2016.
Stochastic shows overbought and the resistance is at $3.36 and next resistance level is at $3.41.
The price support is at $3.26 and next support is at $3.20.
Wednesday, 22 February 2017
Sembcorp Marine (S51) - 22 Feb 2017
Sembcorp Marine Swings to profit in Q4, FY revenue lowest in decade
http://www.channelnewsasia.com/news/singapore/sembcorp-marine-swings-to-profit-in-q4-fy-revenue-lowest-in/3541104.html
http://www.channelnewsasia.com/news/singapore/sembcorp-marine-swings-to-profit-in-q4-fy-revenue-lowest-in/3541104.html
Sembcorp Marine is on a good uptrend with high volume traded today.
Current support is at Fibonacci levels at 1.735 and $1.715.
Resistance levels are at $1.755 and $1.775.
Monday, 20 February 2017
Wilmar Intl (F34) - 20 Feb 2017
Wilmar posts 70% rise in 4Q earnings to $836 mil on stronger all-round performance
Technically Wilmar shows a decline from the Pennant today and it could be a start of a downtrend if it close below $3.85.
The current resistance levels are at $3.94 and $3.99
The technical support levels are at $3.85 and $3.77.
Stochastic shows a downward trend.
Thursday, 16 February 2017
DBS (D05) - 16 Feb 2017
DBS’ Q4 profits fall to two-year low of S$913m
DBS chart unlike OCBC has broken its uptrend line.
The technical support for DBS is at $18.41 and $18.23.
The resistance levels are $18.59 and $18.81.
Stochastic is approaching the oversold area.
Tuesday, 14 February 2017
OCBC (O39) - 14 Feb 2017
OCBC’s Q4 profit falls 18%, hit by bad loans in oil sector
Despite a gaped down in OCBC share price, the uptrend is still intact.
The current price support is at $9.35 and the next price support is at $9.25.
The resistance levels are at $9.48 and $9.62.
Monday, 13 February 2017
SingPost (S08) - 13 Feb 2017
SingPost's net profit slumps 27.9% to $31.4m
http://sbr.com.sg/transport-logistics/news/singposts-net-profit-slumps-279-314m
SingPost is on a downtrend and it gaped down yesterday after the financial results announcement.
The technical support is currently at $1.395 and the next support is at $1.360.
The resistance levels are $1.425 and $1.460.
Thursday, 9 February 2017
SingTel (Z74) - 09 Feb 2017
Singtel's net profit up 2% in Q3 on strong demand for cyber scurtiy, home services.
The technical chart shows that SingTel broke the long-term downtrend line on 05 Jan 2017 and currently on the uptrend.
The current support is at $3.84 which is also the 20-day Moving Average and the support is at $3.79.
The resistance levels are at $3.89 and $3.92.
Tuesday, 7 February 2017
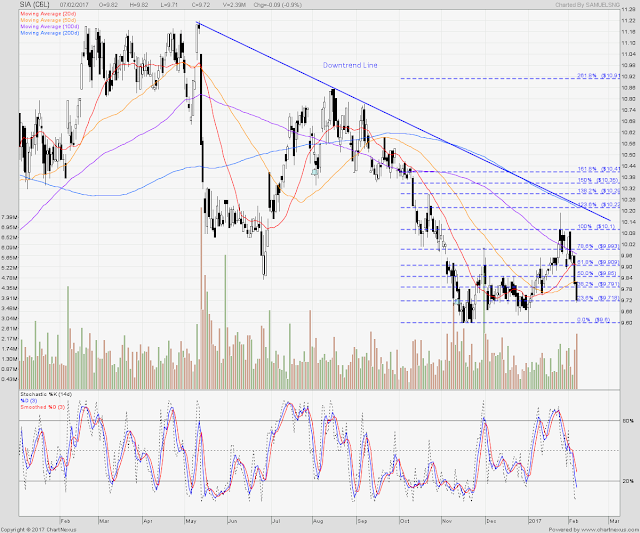
SIA ((C6L) - 07 Jan 2017
Singapore Airlines profit drops 36% amid weak-yield environment
Technical chart shows that SIA is on a long-term downtrend.
Based on today's opening price at $9.90, the technical support is at $9.85 and next support is at $9.79.
The technical resistance is at $9.91 and $9.99.
Sunday, 5 February 2017
StarHub (CC3) - 03 Feb 2017
StarHub's Q4 profit down 33.2% to S$54m
The StarHub weekly chart shows the current support is at $2.770 based on today's opening price of $2.85. The next support is at $2.65.
The price resistance is at $2.88 and the next level is at $2.97.
The chart is heading for a long-term weekly downtrend.
Thursday, 2 February 2017
ComfortDelGro (C52) - 02 Feb 2017
What ComfortDelGro Flexi-Rental Scheme Chould Mean To Consumers
http://aspire.sharesinv.com/39540/what-comfortdelgro-flexi-rental-scheme-could-mean-to-consumers/
The technical charts shows ComfortDelGro is on a downtrend with support at $2.36 and $$2.30
The resistance levels are at $2.45 and $2.53.
Stochastic shows that it is near the oversold levels. Price may stabilise at this juncture.
Tuesday, 31 January 2017
Sembcorp Marine (S51) - 31 Jan 2017
Can the Poly-GCL FLNG contract give Sembcorp Marine a much-needed boost?
Sembcorp Marine is on the uptrend. The technical support is at $1.490 and next support is at $1.465.
The immediate resistance is at $1.520 and $1.535.
Tuesday, 24 January 2017
M1 (B2F) - 24 Jan 2017
M1's Q4 profit down 27.1% to S$31.8m as traditional telco services take a hit
M1 has been on the uptrend since 27 December 2016. Stochastic shows overbought.
After M1's Q4 financial results, the stock opened down today at $2.10 and broke the uptrend line.
The technical price support is at $2.06 and the next support is at $2.03.
The price resistance levels are $2.10 and $2.14.
Monday, 23 January 2017
Keppel DC Reit (AJBU) - 23 Jan 2017
Keppel DC Reit declares distribution of 2.8 cents per unit for H2 2016
Keppel DC Reit technical support is currently at $1.205 and $1.195.
The technical resistance level is at $1.125 and $1.230.
Monday, 16 January 2017
CapitaLand (C31) - 16 Jan 2017
CapitaLand to develop office tower in Ho Chi Minh City
CapitaLand is on the uptrend but Stochastic shows overbought and daily volume is decreasing.
The second chart shows that CapitaLand has broken the downtrend line on 10 January 2017 and is on the uptrend since September 2015.
The second chart shows that CapitaLand has broken the downtrend line on 10 January 2017 and is on the uptrend since September 2015.
Technical resistance levels are at $3.16 and $3.18.
The technical support is at $3.14 and $3.11.
Thursday, 12 January 2017
StarHub (CC3) - 12 Jan 2017
M1, Starhub join forces to combat new telco threat.
http://sbr.com.sg/telecom-internet/news/m1-starhub-join-forces-combat-new-telco-threat
StarHub technical chart shows a double bottom reversal at around $2.75.
http://stockcharts.com/school/doku.php?id=chart_school:chart_analysis:chart_patterns:double_bottom_reversal
It is currently uptrend but interesting to see if it can break the $2.98 resistance level or it will become a double top reversal and retreat.
http://stockcharts.com/school/doku.php?id=chart_school:chart_analysis:chart_patterns:double_top_reversal
Stochastic shows overbought and the trading volume is decreasing.
Subscribe to:
Comments (Atom)


